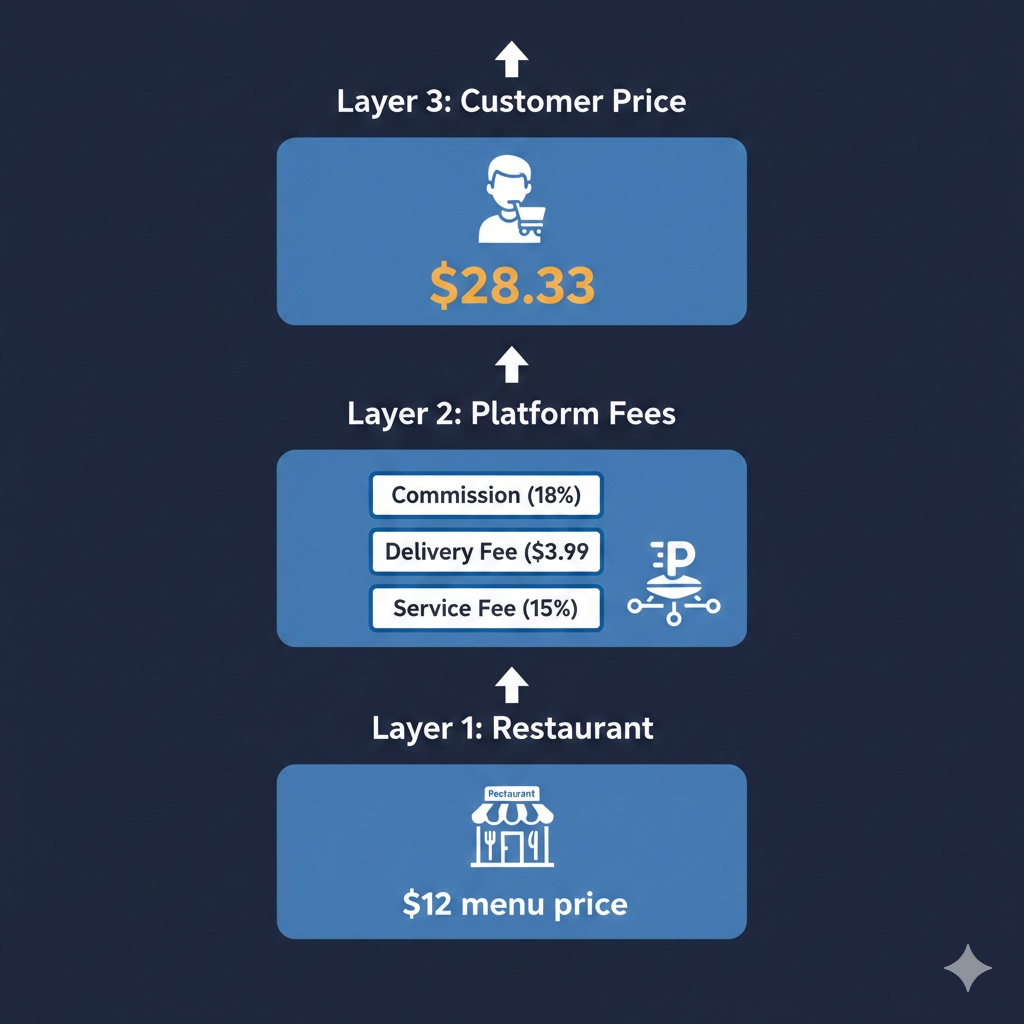
Food delivery platforms are fighting on price, but most are losing on information. A 2024 analysis of major US delivery platforms found that identical orders vary by 18-24% in total cost across apps — not because of delivery fees or tips, but because of how platforms structure the three pricing layers underneath. The teams that understand all three layers are winning. The ones tracking only one are making decisions on incomplete data.
Food delivery pricing isn't a single number — it's a stack. Commission rates (typically 15-30% in the US market, per restaurant operator surveys), customer-facing fees, and driver pay incentives all move independently and interact with each other in ways that aren't visible from any single data source.
Most pricing teams track the layer most visible to them. Restaurant partners watch commission rates. Customer acquisition teams watch delivery fees and promotions. Operations watches driver incentives. Nobody owns the full picture.
The consequence is predictable: a platform reduces commission rates to attract restaurant partners, but simultaneously raises customer fees to compensate — and loses conversion at checkout without understanding why. Or a competitor launches a driver incentive surge in a specific city during a high-demand window, effectively pulling supply and degrading your delivery times, which shows up as a customer satisfaction problem rather than a pricing problem.
In the US, platforms that optimize across all three layers simultaneously report 12-18% better unit economics than those managing each layer in isolation, according to delivery market research published by Second Measure in 2024. The gap exists because the data infrastructure required to see all three layers at once is harder to build than most teams anticipate.
Commission rates are the most discussed lever in food delivery pricing — and the most poorly benchmarked. The headline rate a platform publishes tells you almost nothing useful. What matters is the effective rate after promotional subsidies, volume discounts, and exclusive partnership arrangements are applied.
In practice, a restaurant paying a 28% headline commission rate on a major US platform may be paying an effective rate of 19-21% after promotional support credits are factored in. A competitor offering a "lower" 22% headline rate with no promotional support may represent worse economics for the same restaurant.
For pricing teams benchmarking commission competitiveness, this means tracking at the restaurant-partnership level, not the platform level. It means monitoring which restaurant categories are receiving preferential rate treatment, in which cities, and at what volume thresholds. In high-density urban markets like London or New York, commission structures for top-performing restaurant partners can differ by 6-8 percentage points from the published baseline — a gap large enough to shift partner acquisition outcomes materially.
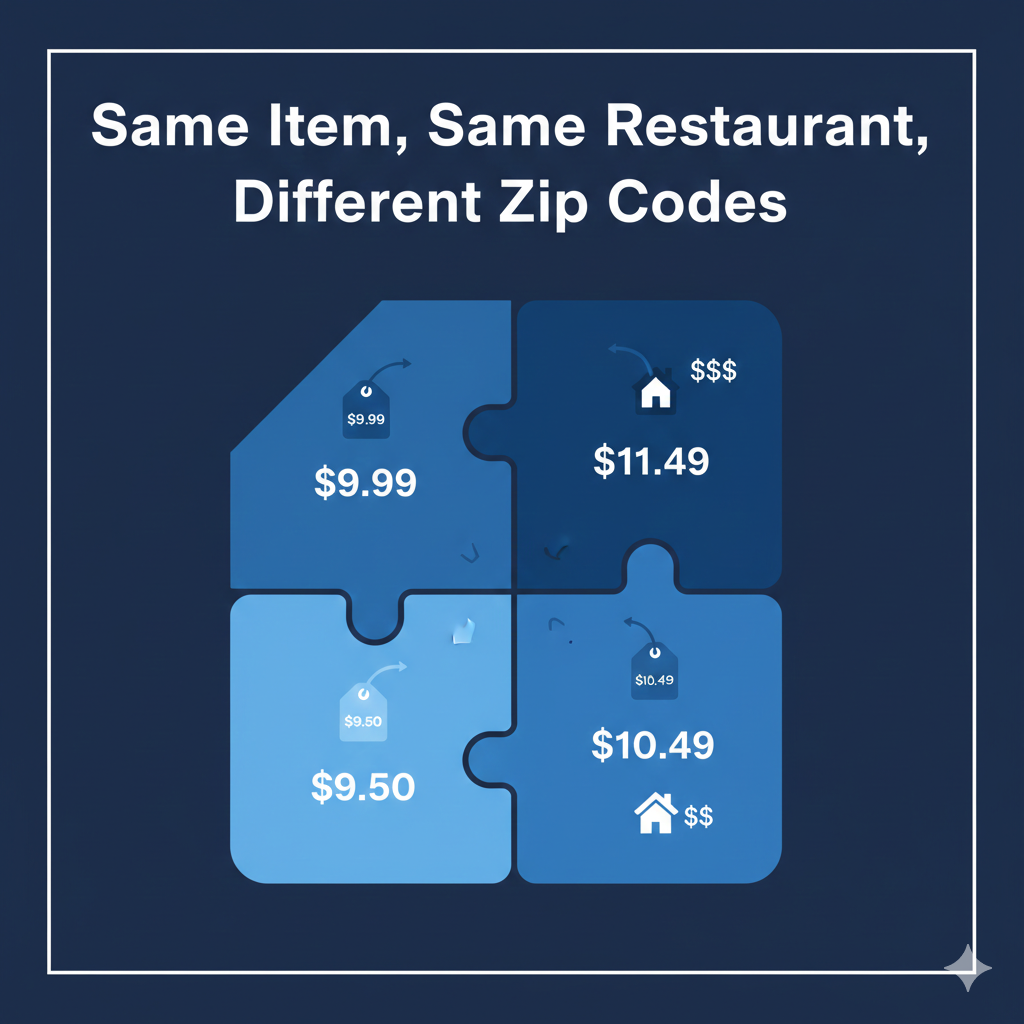
Delivery fee structures don't behave uniformly within a city. A 2023 analysis of US delivery pricing found that fees increase 0.26-0.28 percentage points for every $200K increase in median household income by zip code. The same platform charges meaningfully different effective prices in adjacent neighborhoods — not because of distance or logistics cost, but because of willingness-to-pay modeling built into the fee algorithm.
For pricing teams, this creates a specific problem: city-level competitive benchmarks obscure the micro-geographic variation that actually drives conversion. A platform that looks price-competitive at the city level may be systematically overpriced in high-income zip codes where competitors have calibrated more aggressively — and those are often the zip codes with the highest order values and repeat purchase rates.
In Southeast Asian markets — Indonesia, Vietnam, Thailand — the geographic complexity is even more pronounced. Delivery fee structures vary not just by neighborhood but by traffic corridor, time of day, and weather conditions, with platforms like GrabFood and GoFood making real-time adjustments that city-level benchmarking doesn't capture.
The teams closing this gap are collecting zip-code-level or district-level competitive data, not aggregating to city averages. The difference in data granularity translates directly into more accurate fee calibration and measurably better conversion rates in high-value micro-markets.
Subscription programs — DashPass, Uber One, Talabat Pro — have changed the unit economics of food delivery pricing in ways that standard competitive benchmarking doesn't capture. As of 2024, approximately 62% of US delivery users hold at least one platform subscription, per Bloomberg Second Measure data. At platforms with 70%+ subscriber penetration, the effective customer fee structure looks fundamentally different from the published fee schedule.
A subscriber paying zero delivery fees on every order is experiencing a completely different price signal than a non-subscriber. When a competitor runs a "free delivery" promotion, the impact on subscriber conversion is minimal — they already have free delivery. The impact on non-subscriber conversion can be significant. Pricing teams that don't segment competitive analysis by subscriber vs. non-subscriber are comparing apples to oranges.
This matters for promotional strategy as well. A 20% discount promotion on a platform with 70% subscriber penetration has a different ROI profile than the same promotion on a platform with 35% penetration — because the incremental conversion impact concentrates in different customer segments. Getting this wrong means either over-investing in promotions that don't move the right metric, or under-investing and ceding ground to a competitor who has modeled it correctly.
Promotional pricing in food delivery moves faster than almost any other category. Flash deals, time-limited restaurant offers, platform-funded discounts, and loyalty point multipliers can launch and expire within hours. A competitor running a targeted 30% discount on a specific cuisine category in a specific city on a Friday evening is executing a promotion that your team may not even know happened until the following week's data review — by which time the demand window has closed.
In practice, promotional monitoring at the speed food delivery requires means tracking at sub-daily intervals across every relevant platform, in every relevant market. For a food delivery platform operating across 15 cities in Western Europe, that's a significant data operation. Teams relying on weekly competitive reviews are not monitoring promotions — they're doing post-mortems.
The competitive cost of this lag is measurable. Platforms that respond to competitor promotions within the same demand window retain 15-25% more of the at-risk order volume than those responding 24+ hours later, based on delivery market analysis from European markets in 2023. The window for a competitive response is narrow, and it closes fast.
The specific problems described above — sub-city geographic variation, effective commission rate benchmarking, promotional monitoring at sub-daily intervals, subscription-adjusted fee analysis — require data infrastructure that goes well beyond standard market research tools or manual competitive reviews.
Anakin collects SKU-level pricing, promotional, and availability data across 100+ food delivery and restaurant platforms in 50+ countries, at the refresh frequency that delivery pricing actually demands. The underlying data pipeline is built to handle the platforms that matter most in delivery — GrabFood, GoFood, Talabat, DoorDash, Uber Eats, Swiggy, Zomato — including those with dynamic rendering and geo-restricted access that most monitoring tools fail to capture reliably.
For pricing teams that need to close the gap between what's happening in the market right now and what their competitive dashboard shows, that's the infrastructure problem Anakin solves.
See How Anakin Works
If you're managing pricing across food delivery markets and need competitive data at the geographic granularity and refresh frequency that delivery pricing demands, see how Anakin works. We can walk through coverage for your specific markets and platform set.