

Pick a product you sell. Anything with national distribution. A bottle of laundry detergent, a protein bar, a bag of dog food.
Now look it up, right now, in the following places:
Write down the six numbers.
They are not the same number. In some categories the spread exceeds 40%. And every one of them is a price your customer sees, compares, and uses to form a judgment about whether your brand is expensive.
That spread is not a curiosity. It is the measurement gap in competitive pricing intelligence today — and most of the tools built to close it were designed before half of those surfaces existed.
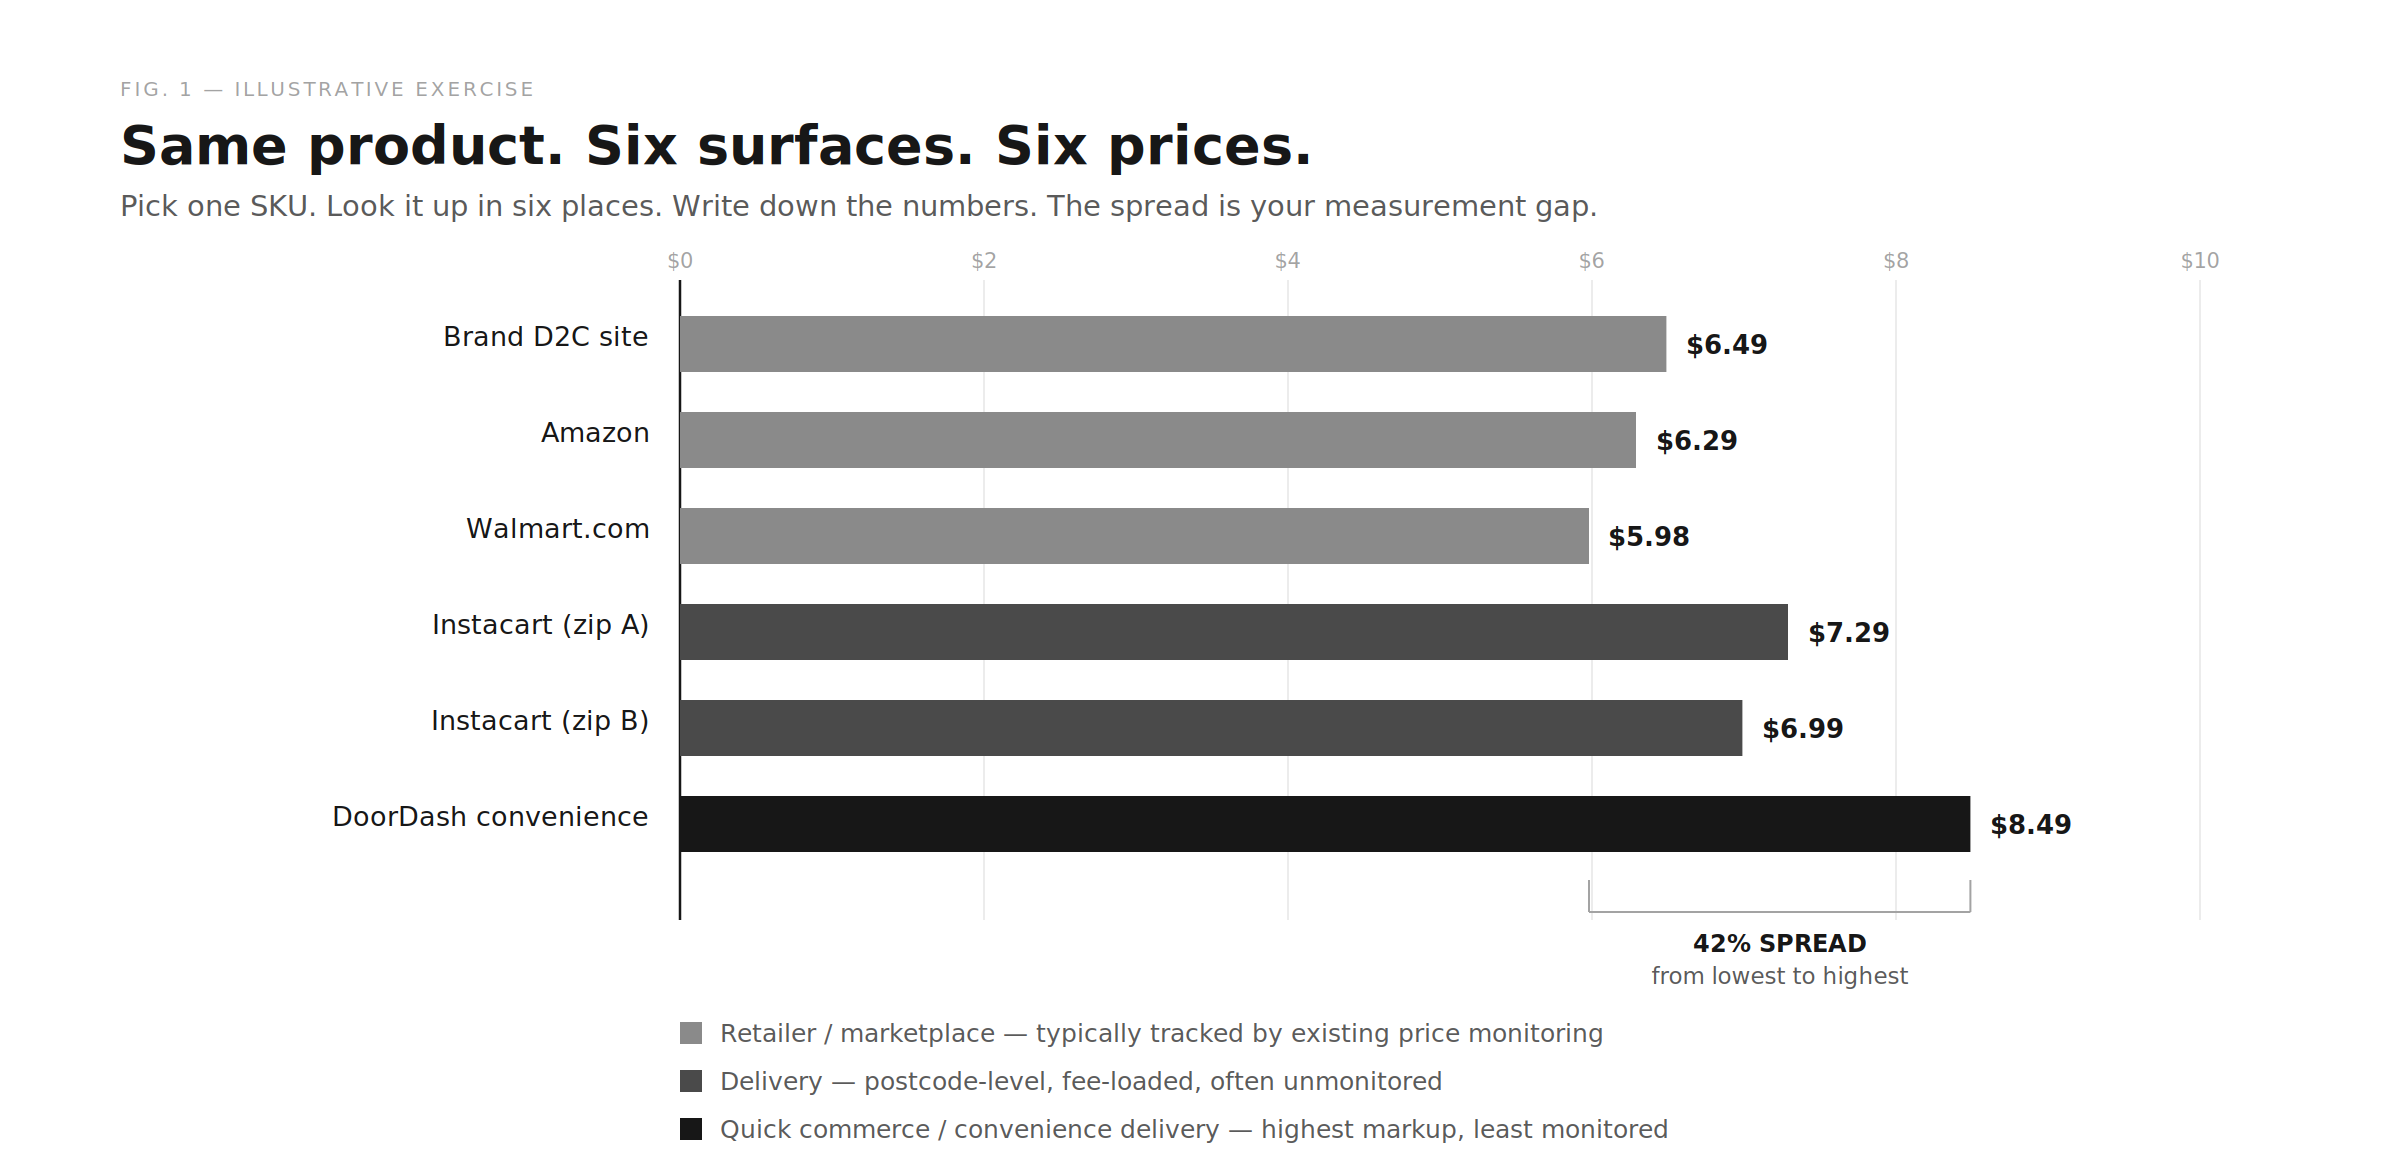
The six numbers above are not six copies of one decision. They are six independent pricing events, each set by a different actor, each subject to different economics.
The price on your own site is yours. You set it, you own it, you can change it at will. This is the number most competitive price monitoring tools were built to track, and it is the only one in this list where the brand has full control.
The price on Amazon is yours in theory. In practice it is shaped by the Buy Box algorithm, by third-party sellers who may or may not be authorised, by Amazon's own pricing pressure, and by the promotional mechanics of the marketplace. A brand's "price on Amazon" is better understood as the price Amazon's system surfaces to a particular shopper at a particular moment.
The price on a retailer's own site — Walmart.com, Target.com, Kroger.com — is the retailer's. It reflects their margin targets, their promotional calendar, and their competitive response to the marketplace price, which they can see too.
The price on Instacart at one zip code adds a layer. Instacart's pricing can vary by retailer banner, by store location, and by whether the item is fulfilled from a partner store or from Instacart's own inventory. The shopper also pays a delivery fee, a service fee, a possible heavy-item fee, and optionally a tip — none of which are set by the brand and all of which change the delivered cost.
The price on Instacart at a different zip code can be a different number for the same banner, because the underlying store has different pricing or because a different fulfilment model applies.
The price on a delivery app — DoorDash, Uber Eats, Gopuff — typically includes a platform markup over the in-store price, a separate delivery fee, a service fee, and in some cases surge pricing tied to demand. The item price the shopper sees is not the price the retailer or brand set. It is the price the platform set, derived from but not equal to the wholesale or retail price, and it varies by time of day and by location.
None of this is new. All of it has been true for years. What is relatively new is the volume share moving through these surfaces, which in many US grocery and convenience categories is now large enough that ignoring the platform prices means ignoring the prices.
This is the part that breaks the standard model of competitive price monitoring.
Traditional price intelligence tracks the item price — what the product is listed at. On a retailer website or a marketplace, that is a reasonable proxy for what the customer pays. The customer adds tax, maybe shipping, and the gap between listed price and paid price is small and predictable.
On a delivery surface, the gap is not small. Consider an illustrative example — a $6.49 item ordered through a grocery delivery app:
The customer paid $14.74 for a $6.49 product. The fee stack more than doubled the price. And every component except the item price was set by the platform, not by the brand or the retailer.
Now suppose a competitor's version of the same product is listed at $5.99 on the same app. The $0.50 difference in item price is real but marginal. The fee stack — identical for both products — dwarfs it. The customer's actual price comparison is $14.24 versus $14.74, a 3.4% gap on a 7.7% difference in listed price. The fee layer compressed the competitive signal by more than half.
These figures are illustrative — the point is the shape of the effect, not the exact dollar amounts, which vary by platform, basket, and location. If your pricing team is monitoring the item price and ignoring the fee layer, they are working with a signal that overstates competitive gaps on delivery surfaces by a factor of two or more. That error compounds in both directions: it makes you look more expensive than you are in some cases and cheaper than you are in others.

On a retailer's website, the listed price is usually national or at most regional. Two shoppers in different cities see the same number.
On a delivery surface, price is local by construction. The underlying store sets prices that reflect its local competitive set, its own cost structure, and sometimes its own promotional calendar. The platform applies a markup that may vary by market. The delivery fee reflects local driver economics. The service fee is a percentage of a locally-determined basket.
The consequence is that a "national average" of competitor prices on delivery surfaces is not a summary. It is an artefact — a number that no actual customer anywhere actually pays. It is the mean of a distribution whose variance is the thing that matters.
A pricing team that needs to respond to a competitive threat in Houston cannot act on a national average that includes Manhattan, rural Minnesota, and a college town in Oregon. The granularity of the competitive signal must match the granularity of the pricing decision, and on delivery surfaces the pricing decision is made at the postcode level or narrower.
This is not a call for more data. It is a call for differently shaped data. A national feed of item prices was adequate when the shelf was national. A postcode-level feed is required when the shelf is local.
Instacart+, DoorDash DashPass, Uber One, Walmart+ and Amazon Prime each create a two-tier pricing system: one price for subscribers, another for everyone else. On some platforms the subscriber sees a lower item price. On others the item price is the same but the delivery fee drops to zero. On still others the subscriber gets access to exclusive promotions that change the effective price without changing the listed price.
A brand monitoring its competitive position needs to know which price it is looking at: the subscriber price or the non-subscriber price. On many platforms these are literally different numbers for the same product at the same moment.
Most price monitoring tools collect one of them. The question is whether anyone on the buying side knows which one.
This is the version you can run internally in less than an hour. It does not require any tooling, any vendor, or any budget. It requires one person, one product, and a browser.
Step 1. Pick one SKU in your category — ideally a high-velocity item with broad distribution.
Step 2. Record its price on six surfaces: your own site, Amazon, one major retailer site, Instacart at your office zip code, Instacart at a zip code 1,000 miles away, and one delivery app (DoorDash or Uber Eats) at either zip code.
Step 3. For the delivery and Instacart prices, record the fee components separately: item price, delivery fee, service fee, any surcharges.
Step 4. Calculate the delivered total for each surface.
Step 5. Compare the spread. Item price spread versus delivered price spread. National versus local. Subscriber versus non-subscriber if accessible.
Step 6. Ask: does our current competitive price monitoring capture any of the surfaces where the price was different? Does it capture the fee layer? Does it operate at the postcode level?
If the answer to all three is yes, your measurement matches your market and this article wasted your time.
If the answer to any of them is no, the gap between what you are measuring and what your customer is experiencing is the number you just calculated — and it is probably larger than the competitive price moves your team spent last quarter responding to.
It does not mean traditional price monitoring is useless. Retailer sites and marketplaces still carry enormous volume, and the item price on those surfaces is still the most commercially significant single number for most brands. Monitoring it is table stakes.
It means that table stakes used to be the whole game, and now table stakes is part of the game. The surfaces where price is set by a platform, shaped by fees, localised by postcode, and split by subscription tier are growing in share. In some categories they are already material. The measurement infrastructure has not caught up.
The correction is not to replace what exists. It is to extend it — to add the surfaces, the fee layers, the geographic granularity, and the tier segmentation that the current generation of tools was not designed to capture.
That is a category-level observation, not a product recommendation. We obviously have a view on who should provide the extension, and it is us. But the gap is real regardless of who fills it, and any buyer in this category should be asking every vendor — including us — the same question: which of those six prices can you actually show me?
Is the item price still the most important competitive signal?
On retailer websites and marketplaces, yes. On delivery and quick-commerce surfaces, the delivered total — item plus fees — is the number the customer compares. Monitoring only the item price overstates competitive gaps by a factor of two or more on those surfaces.
How much does competitor pricing vary by postcode on delivery apps?
It depends on the category, but competitor prices for the same SKU can vary significantly across zip codes within a single metro area on Instacart and DoorDash. National averages on these surfaces are not summaries — they are artefacts.
Do price monitoring tools capture delivery fees and service fees?
Most enterprise digital shelf analytics and price monitoring platforms were built to track item prices on retailer sites and marketplaces. Fee-layer data from delivery and quick-commerce platforms is largely absent from the enterprise vendor set.
How can I measure the gap in my own category?
Pick one SKU, record its price on six surfaces, calculate the delivered total on each, and compare the spread. The method is described step by step above. It takes one person less than an hour and requires no tooling.
If the exercise produces a number that surprises you, we will run it across your full competitive set and show you the result — no call required.